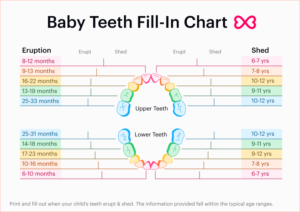
Part of child care can be helping parents keep track of developmental milestones like teething signs, by using tools like a baby teeth chart. Most babies typically get their first tooth during their first year. Some babies are late bloomers and get theirs close to the end of the first year or just after. Regardless, the parents might want a baby teeth chart to keep track. It keeps them and you organized and can be a great memento.
 What Exactly Is A Baby Teeth Chart?
Baby teeth charts, sometimes called baby tooth eruption charts, are diagrams of a baby’s mouth. They show when all the primary, or deciduous, teeth come in, or erupt from the gums. There are a total of 20 deciduous teeth. These are eventually shed as children get older and their adult, or permanent, teeth erupt.
Lower central incisor: 6-10 months
Upper central incisor: 8-12 months
Upper lateral incisor: 9-13 months
Lower lateral incisor: 10-16 months
Upper first molar: 13-19 months
Lower first molar: 14-18 months
Upper canine or cuspid: 16-22 months
Lower canine or cuspid: 17-23 months
Lower second molar: 23-31 months
Upper second molar: 25-33 months
As you can see, usually the bottom front teeth come in first. Often the four upper central incisors follow. Of course, every baby’s teeth timeline is as unique as they are. So don’t fret if things seem to be going out of order. Parents should schedule an appointment with a pediatric dentist as soon as the first tooth erupts. As questions come up, let them know they can always use this teething chart and ask the dentist for additional insights.
Other Types Of Teeth Charts
You’ll see some variety across baby teeth charts and diagrams. Some dentists use a teeth number chart where numbers are designated to each tooth. You may see these numbers on dental patient charts.
Other teeth charts also include the likely age your child will lose that baby tooth. This is called the shed date. Shedding usually begins around age 6, so new parents have some time to prep for the tooth fairy’s arrival. A kid’s tooth loss chart may also include when adult teeth are likely to erupt. Eventually, by age 21, they’ll have 32 adult teeth.
 How Can A Baby Teeth Order Chart Help A Baby?
Planning Ahead
Teething can be a fussy, painful experience for you, the parents, and the baby. As their gums get sore and the potential for drool rashes and other symptoms increase, a baby tooth chart can give you a leg up. While they’re not exact, you can use the diagrams to help you plan for when a little one may be feeling some more irritation.
Keeping Track
Use it as a tracker and a guide for their teething timeline and development journey. You can check off when one tooth emerges, and as they get older when that same tooth is shed. Or you can see how space emerges between the teeth as your child’s jaw grows to accommodate their incoming adult teeth.
If parents are concerned about a particular tooth, download and use this chart to confirm which one so you can watch out too. You may want to combine a baby teeth eruption chart with an adult teeth diagram during ages 6 through 12 when the baby will have a mixture of primary and permanent teeth in their mouths.
Basically, this is just one more piece you can keep in your babycare toolbox. A prepared sitter is an incredible asset to a family. Ready to use your compassion and experience in child care? Meet your next family on Sittercity.


